Reading Histograms
Grade 6 Math Worksheets
What is a Histogram?
A histogram is a graphical representation of data that is organized into intervals, or bins, along with the frequency or count of observations falling into each bin.
It provides a visual summary of the distribution of a dataset, showing the patterns and characteristics of the data.
Using a histogram worksheet provides practical experience in data analysis, visualization, and interpretation. It strengthens your data literacy skills and empowers you to make better-informed decisions based on the insights derived from histograms.
Personalized Online Tutoring
Stratified Sampling - Grade 7 Math Worksheet PDF
This is a free worksheet with practice problems and answers. You can also work on it online.
Sign up with your email ID to access this free worksheet.
"We really love eTutorWorld!"
"We really love etutorworld!. Anand S and Pooja are excellent math teachers and are quick to respond with requests to tutor on any math topic!" - Kieran Y (via TrustSpot.io)
"My daughter gets distracted easily"
"My daughter gets distracted very easily and Ms. Medini and other teachers were patient with her and redirected her back to the courses.
With the help of Etutorworld, my daughter has been now selected in the Gifted and Talented Program for the school district"
- Nivea Sharma (via TrustSpot.io)
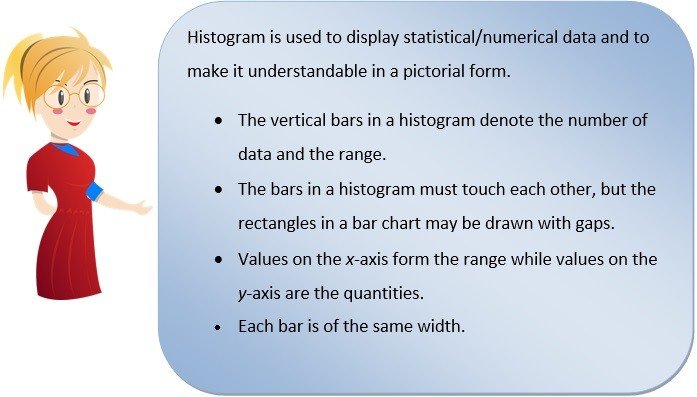
Why do you use a Histogram?
A histogram is an illustrative way to represent particular data. It is shown in vertical bar formation for a particular input against the number of continuous data given, which is said to be the frequency in each category.
A histogram is a single block graph of rectangles where the area of each rectangle will be proportional to the frequency.
Solved Examples
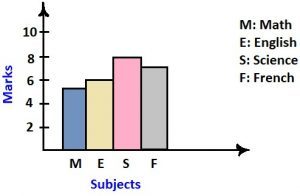
Example 1
The points scored by John in his school test were marked in 10 for subjects Math, English, Science, and French as 5, 6, 8, and 7 respectively. Represent the above data in a histogram.
Solution
Example 2
The following histogram shows the number of singers who sang music albums in a year. Find the following:
- Highest number of songs sung in a year.
- The least number of songs sung.
- Number of songs 14 singers sang.
- How many singers sang 3-4 songs?

Your content goes here. Edit or remove this text inline or in the module Content settings. You can also style every aspect of this content in the module Design settings and even apply custom CSS to this text in the module Advanced settings.
In such a pictorial representation it is easy to identify and find out, calculate a specific detail instead of analyzing the whole data.
Solution:
- Grey colored bar on the graph states that 6 is the highest number of songs sung.
- Purple colored bar denotes 1 is the least number of songs sung.
- 5-6 songs were sung by 14 singers.
- 11 singers sang 3-4 songs.
Example 3
Following is the histogram view of data showing the list of people who order home utilities online.
Basic items sold online are furniture, kitchen appliances, mobile phones, and groceries.
- Find the product that is sold largely.
- How many people buy groceries online?
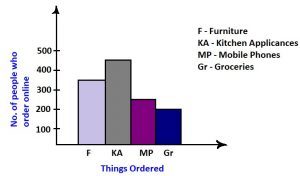
Solution
- The product which is sold largely is kitchen appliances.
- Between 0-200 people buy groceries online.
Practice Questions
Question 1
Use the histogram to identify how long a student spends time on gadgets on school off days.

a. How many students spend only 5-10 hours?
b. How long do 4 students spend on gadgets?
c. Number of students spending the maximum number of hours.
Question 2
Sheila collected the details of no. of novels sold in a book fair and made a histogram of the data which showed the no. of books sold between 20-200 dollars.
a. Draw a histogram if the following is the data collected.
| No. of books (novels) | Amount (in Dollars) |
| 20 | 55 |
| 30 | 80 |
| 40 | 75 |
| 50 | 150 |
| 60 | 30 |
| 70 | 105 |
| 80 | 125 |
b. How many books were sold between $150 and $105?
Answer key
1.
a. 3 students
b. 10 – 15 hours
c. 9 students
2. The histogram made by Sheila will look like this:

b. 20 books were sold between $105 and $150.
“There have been times when we booked them last minute, but the teachers have been extremely well-prepared and the help desk at etutorworld is very prompt.
Our kid is doing much better with a higher score.”
7th Grade Tutoring
eTutorWorld offers Personalized Online Tutoring for Math, Science, English, and Standardised Tests.
Our Tutoring Packs start at just under $22.49 per hour, and come with a moneyback guarantee.
Schedule a FREE Trial Session, and experience quality tutoring for yourself. (No credit card required.)
Do You Stack Up Against the Best?
If you have 30 minutes, try our free diagnostics test and assess your skills.

Gloria Mathew writes on math topics for K-12. A trained writer and communicator, she makes math accessible and understandable to students at all levels. Her ability to explain complex math concepts with easy to understand examples helps students master math. LinkedIn
Affordable Tutoring Now Starts at Just $22.49
eTutorWorld offers affordable one-on-one live tutoring over the web for Grades K-12. We are also a leading provider of Test Prep help for Standardized Tests (SCAT, CogAT, MAP, SSAT, SAT, ACT, ISEE, and AP).
What makes eTutorWorld stand apart are: flexibility in lesson scheduling, quality of hand-picked tutors, assignment of tutors based on academic counseling and diagnostic tests of each student, and our 100% money-back guarantee.

Whether you have never tried personalized online tutoring before or are looking for better tutors and flexibility at an affordable price point, schedule a FREE TRIAL Session with us today.
*There is no purchase obligation or credit card requirement
IN THE NEWS


Our mission is to provide high quality online tutoring services, using state of the art Internet technology, to school students worldwide.

Online test prep and practice
SCAT
SSAT
ISEE
PSAT
SAT
ACT
AP Exam
Science Tutoring
Physics Tutoring
Chemistry Tutoring
Biology Tutoring
Math Tutoring
Pre-Algebra Tutoring
Algebra Tutoring
Pre Calculus Tutoring
Calculus Tutoring
Geometry Tutoring
Trigonometry Tutoring
Statistics Tutoring
Quick links
Free Worksheets
Fact sheet
Sales Partner Opportunities
Parents
Passive Fundraising
Virtual Fundraising
Our Expert Tutors
Safe and Secure Tutoring
Interactive Online Tutoring
After School Tutoring
Elementary School Tutoring
Middle School Tutoring
High School Tutoring
Home Work Help
Math Tutors New York City
Press
©2022 eTutorWorld Terms of use Privacy Policy Site by Little Red Bird
©2022 eTutorWorld
Terms of use
Privacy Policy
Site by Little Red Bird